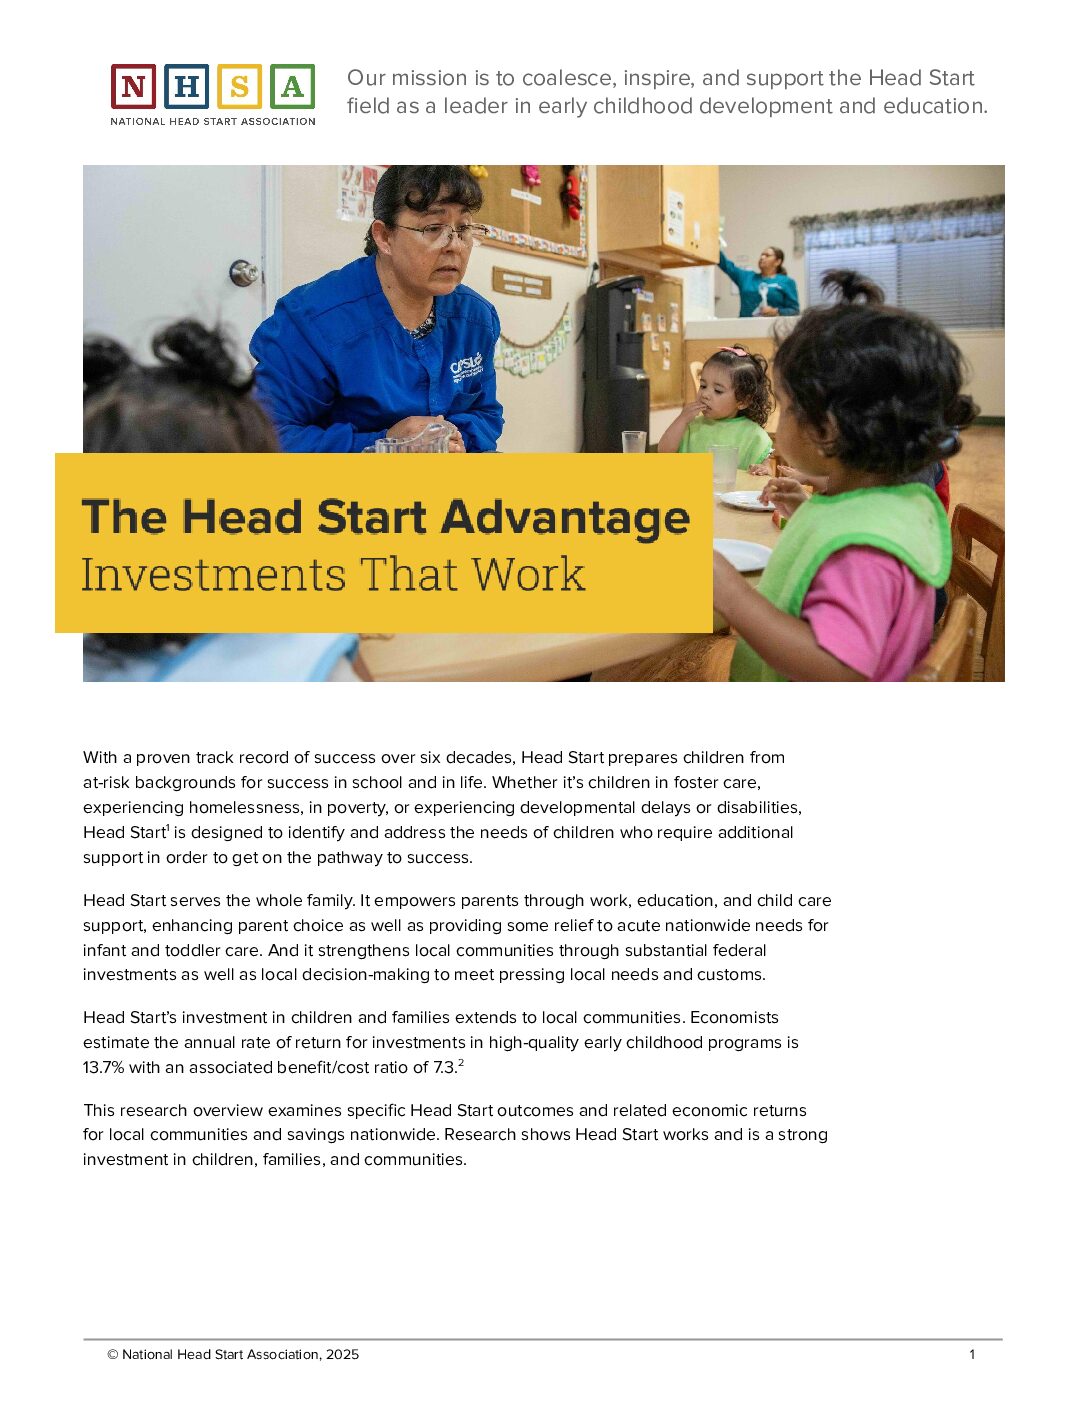
With a proven track record of success over six decades, Head Start prepares children from at-risk backgrounds for success in school and in life. Whether it’s children in foster care, experiencing homelessness, in poverty, or experiencing developmental delays or disabilities, Head Start1 is designed to identify and address the needs of children who require additional support in order to get on the pathway to success.
Head Start serves the whole family. It empowers parents through work, education, and child care support, enhancing parent choice as well as providing some relief to acute nationwide needs for infant and toddler care. And it strengthens local communities through substantial federal investments as well as local decision-making to meet pressing local needs and customs.
Head Start’s investment in children and families extends to local communities. Economists estimate the annual rate of return for investments in high-quality early childhood programs is 13.7% with an associated benefit/cost ratio of 7.32.
This research overview examines specific Head Start outcomes and related economic returns for local communities and savings nationwide. Research shows Head Start works and is a strong investment in children, families, and communities.
Preparing Children For Success
Early Intervention
Early intervention to address a child’s developmental delays reduces the likelihood of costly special education services and grade repetition later. Children from families with low incomes are often identified at an older age, when early intervention services are less effective, due to limited access to high-quality early childhood education programs.
- Head Start screens all children, identifying potential delays and disabilities, connecting them with needed services early, when intervention is most impactful. In 2023-24, 570,172 Head Start children were up-to-date on Early and Periodic Screening and Diagnostic and Treatment screenings3.
- Participation in high-quality early education reduces special education placement by 8.1 percentage points and increases high school graduation rates by 11.4 percentage points.4
- The average cost of repeating a grade is $8,000-9,000 per child.5
- An estimated 14.2% of Head Start children have suspected and/or identified delays and disabilities. Head Start programs ensure children with disabilities receive timely and appropriate services.
- The average cost per child for special education services is $13,127, or $38.8 billion nationwide.6
School Readiness
Children who are “ready” for kindergarten take a positive approach to learning, perform many tasks independently, and have self-regulation and executive functioning skills–things like knowing how to share, follow instructions, and express feelings with words instead of hands.
- By the end of Early Head Start, three-year-old children scored significantly higher than a control group on cognitive, language, and social-emotional developmental measures.
- Head Start children have better social skills, impulse control, and approaches to learning. Head Start children also decrease their problem behaviors, such as aggression and hyperactivity.7
- Head Start children in foster care or other non-parental care are more ready for school.8
Graduation and Beyond
Completing high school, and pursuing education and training beyond a high school diploma, correlate to higher employment, lifetime earnings, and a host of other positive outcomes.
- Head Start children are 2.7 percent more likely to finish high school, 8.5 percent more likely to enroll in college, and 39 percent more likely to finish college.9
- Children who graduate from high school are more likely to be employed than those without a diploma.10
- High school graduates earn almost $375,000 more than non-graduates over a lifetime.11
- Head Start graduates were more self-sufficient, less likely to live in poverty as adults, less likely to receive public assistance, and less likely to be arrested or charged with a crime. They were also more likely to be healthier, reducing health costs.12, 13
- Head Start graduates are less likely to become teen parents, and when they are parents, they report investing more into their own children.14
- Children of former Head Start students have positive impacts on cognitive and socioemotional development through third grade, including improved mathematics skills and reductions in withdrawn and aggressive behavior, driven largely by differences in family resources and home learning environments.15
Strengthening Families
Child Care and Parent Employment
More than two-thirds of children under age five require child care, due to all available parents working outside the home. And yet, approximately 60% of rural families, and 55% of low-income families, live in child care deserts, areas with an insufficient number of licensed child care providers.16 Cost is also prohibitive–in 28 states, the cost of care for an infant is greater than the cost of a year of college.17 The impacts on families–and the economy–are vast. While the average family spends 24% of their income on child care, for single-parent households, it is up to 75% of their income.18, 19
- Over 55% of Head Start programs are in rural areas, where child care deserts most often exist.20
- 539,848 of Head Start parents are employed, in school, or in a job training program.21
- Insufficient child care, or none at all, costs individual parents more than $5,500 per year, or over $78 billion in total.22
- On average, businesses lose $1,640 a year for each working parent, totaling over $23 billion each year, due to lost revenue and hiring costs because of insufficient child care.21
Parent Education
Higher levels of education increase opportunities for employment, reducing the risk of living in poverty. Adults without a high school diploma have lower tax contributions, higher unemployment rates, higher poverty rates, higher reliance on welfare and Medicaid, and lower lifetime earnings.23
- Head Start enhances parents’ education levels, employment statuses, and incomes by working with them to set and reach education and employment goals, and enabling them to go to school or work while their child is in a high-quality learning environment.
- In 2023, 25% of adults over 25 without a high school diploma lived in poverty.24
- The average annual earnings difference between a high school diploma and a bachelor’s degree or higher is $32,000.25
- Twenty-one percent of women with only a high school diploma live in poverty.26 More than four in five single parents are mothers, and 28% meet the definition of poverty.27
Parenting Skills
Parental education and employment impact family socio-economic outcomes, poverty status, reliance on public assistance, and most importantly, are strong predictors of children’s cognitive outcomes and academic achievement.28
- Head Start families have fewer family conflicts and fewer parent-child dysfunctional interactions,29 which in turn, reduces children’s aggressive behaviors.
- Head Start improves parents’ skills, reduces parental stress, and improves overall family stability and self-sufficiency.
- Head Start increases levels of nonresident fathers’ contact and engagement with children.30
- Children with involved fathers have stronger cognitive and motor skills, better school performance, fewer behavioral issues, higher levels of self-control, and greater confidence.31
- When families participate in Head Start (as opposed to no early childhood education), children are 93% less likely to end up in foster care.32
- Parent education and positive parenting practices reduce the risk of child abuse.33
- The federal government spends approximately $12 billion on foster and child welfare programs annually.34
Entrusting Local Communities
Head Start funding, which is targeted directly at local organizations across the country, empowers decision-making at the community level to assess and address the unique needs of children and families while supplementing the strengths and resources of each community. Twenty percent of programs’ funding comes from local contributions through a required match, resulting in more than $2 billion per year in additional investment in local communities.
Head Start Investments in Communities
| $12,271,820,000 | Head Start federal funding35 |
| $3,067,955,000 | 20% required local match |
| $15,339,775,000 | Total investment in local communities throughout the U.S. |
Conclusion
Head Start’s investment in 40 million children and their families over the past six decades has paid dividends in a multitude of ways. Parents choose Head Start knowing that its high standards, school readiness focus, and comprehensive services will help their child to get a strong start in life. And, with a 13.7% annual rate of return for high-quality early childhood education, Head Start is an investment that pays dividends decades into the future.
1 which includes Head Start Preschool, Early Head Start, Early Head Start - Child Care Partnerships, and additional programs for the Alaska Native/ American Indian and Migrant and Seasonal agriculture worker communities
2 Garcia, J. L., Heckman, J. J., Leaf, D. E., & Prados, M. J., 2017
3 Office of Head Start Program Information Report (PIR) data, as cited in NHSA, 2025
4 McCoy, et al., 2017
5 McCoy, et al., 2018
6 Bellwether, 2024
7 Aikens et al., 2013
8 Lipscomb et al., 2013
9 National Bureau of Economic Research, 2021
10 Urban Institute, 2023
11 US Career Institute, 2023
12 Bailey, M. J. et al., 2020
13 Whitmore Schanzenback, D., & Bauer, L., 2016
14 Barr, A., & Gibbs, C. R., 2017
15 Chor, 2018
16 Center for American Progress, 2018
17 NetCredit, 2023
18 Newsweek, Jan. 19, 2014
19 Women’s Bureau, U.S. Department of Labor, 2023
20 Federal Register, 2024
21 Office of Head Start Program Information Report data, 2024 (Reported in NHSA Fact Sheet, 2025)
22 CBS News, 2023
23 National Center for Education Statistics, n.d.
24 U.S. Census Bureau, 2023
25 Pew Research Center, 2024
26 Pew Research Center, 2024
27 Center for American Progress, 2024
28 Dubow, E. R., Box, P., & Huesmann, L. R. (2009), and González, L, Cortės-Sancho, R., Murcia, M, Ballester, F., Rebagliato, M., & Rodriguez-Bernal, C. L. (2020).
29 Love, J. M. et al, 2002 (Mathematica)
30 Haralampoudis, A., & Nepomnyaschy, L. D. 2021.
31 U.S. Department of Health & Human Services, updated 2024
32 Klein et al, 2017
33 Children’s Bureau. Child Welfare Information Gateway. (2019)
34 Administration for Children & Families, Children’s Bureau, 2024
35 US Department of Health and Human Services, 2024

